Warning: this is a very nerdy post, even by my standards.
A couple of weeks ago, Scotland held elections to its devolved parliament in Holyrood. Similarly to Ireland, they use a system of proportional representation, but unlike our PR-STV, they use something called Additional Member System (AMS). This system is called Mixed-Member Proportional Representation (MMP) everywhere else in the world because Britain just has to be different. What’s interesting here – and the purpose of this post – is how different proportional systems create different results. There’s an argument to be had over whether or not a strictly proportional system is the best one, but we’ll get into that in a moment.
But first off, what is AMS? If you know all this already, you can skip this section by clicking here. But if you don’t, it’s a bit of a confusing one. Everyone votes for a candidate in their constituency, decided using the same First Past the Post (FPTP) system used to elect MPs to Westminster in the UK. They then have a second vote where they vote for a party – this part is known as the “list”, and applies to a region made up of several constituencies. Unlike PR-STV, there’s no additional preferences; the outcome is decided by a mathematical formula.
The formula used here is the d’Hondt method, which was invented by American founding father Thomas Jefferson and then refined a century later by some Belgian dude named d’Hondt. Perhaps it’s not fair that Jefferson doesn’t get to own the name, but then again he would have known all about owning things that weren’t his to own. Regardless, the system works by dividing the number of votes for each party by the number of seats won, and then assigning a seat for each “round” based on that. So for example, Party A has 10 votes, Party B has 3, and there are 5 seats to be allocated, it will look a little something like this.
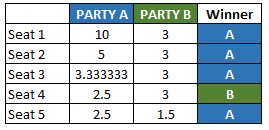
Party A got around 77% of the vote and won 80% of the seats in this example – and that’s as close as one can get to exactly proportional in this example. I know what you’re thinking though – doesn’t having this system and constituency votes create an advantage for the most popular party? And yes, you’d be right. So to offset this, what AMS does is it counts constituency seats as seats already won for the purposes of dividing the vote. Let’s revisit the above example, but let’s imagine it was under AMS, with five constituency seats in addition to five list seats. And let’s say in this example, Party A had already won all five constituency seats. You’d then get something like this:
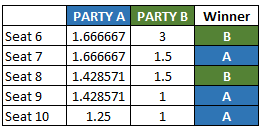
This ultimately gives the same proportional outcome: 80% of seats for Party A (5 constituency plus 3 list). The fact is – and it’s embarrassing how much maths I did before the penny dropped for me – AMS produces identical outcomes to an election run purely on a d’Hondt basis, but by allowing each constituency to choose their representative, it allows them to elect specific people, which a pure list system would not.
So that’s the system stuff out of the way – on to the results. A couple of caveats here, because you can’t, naturally, do a 1:1 mapping:
- Under AMS or any kind of list system, Independents would likely suffer badly. For the purposes of this piece I’ve treated Independent/Other as a list; while this is unrealistic, it’s useful to illustrate the basic point about proportionality
- To fully replicate the Scottish system, I would need to have redrawn almost all of Ireland’s constituency boundaries and then worked out the vote. While this is theoretically doable as approximate vote data per ED can be derived in nearly all constituencies thanks to Dr. Ian Richardson’s work, it would have taken far too long for me to do that
- As mentioned above, since AMS produces the same outcomes as d’Hondt, I split Ireland up a few different ways and just did a d’Hondt measurement to again avoid redrawing constituencies
- I used the April projection numbers as the comparison point

On the above table “PRSTV” is the projection based on our current system. “Strict” is what is exactly proportional (or as close to as possible) based on FPV. “1 region” takes the national vote and allocates it under AMS. “4 region” does the same but with seats assigned proportionate to population to each of Connacht-Ulster, Dublin, Munster and Rest of Leinster. “8 region” splits Ireland into 8 regions of (very) roughly equal population, and is the closest to the model used in Scotland.
As you can see, when the d’Hondt system is applied nationwide, it’s as proportional as you can get. The more you break it down, the more things skew towards bigger parties. I want to talk a bit more here about the “8 region” model designed to mimic the Scottish system. To illustrate:
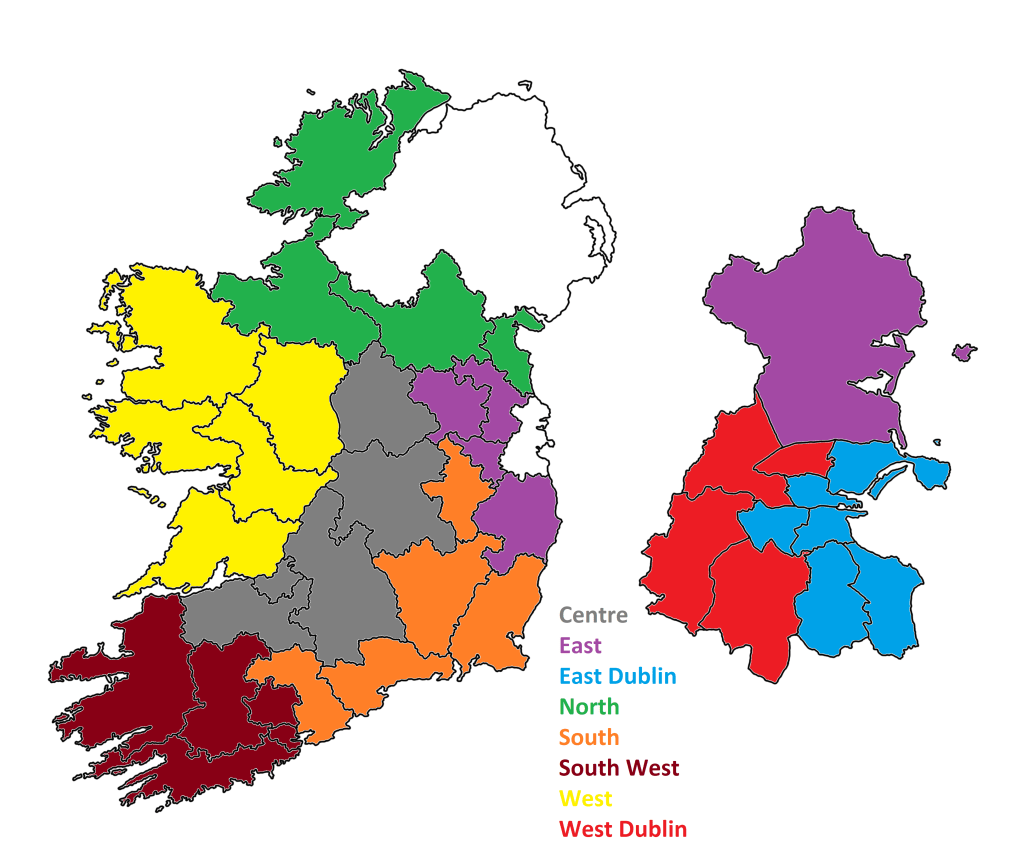
These regions are, I admit, fairly arbitrary, and people could swap them around to make their own if they wanted, but again it was that or spend weeks fiddling around with EDs, which I wasn’t up for. It’s probably also worth noting that they aren’t really much more arbitrary than current boundaries, which in a majority of cases adhere at least partially to Ireland’s administrative counties. (There’s a whole rant I could go on here about how counties are merely enduring artifacts of early modern-era English carve-ups of the land to make an easier transition to proto-colonial administration, and are thus themselves incredibly arbitrary, but I’ll spare ye.)
I assigned each of these regions an equal number of TDs (20), adjusted the vote in each base county for projected swing, summed up the vote totals for each party, counting IND/O as a single bloc, and then used d’Hondt to distribute the seats. As you can see from the chart above, this ended up sitting somewhere between the purely proportional list distribution and the existing PR-STV projection.
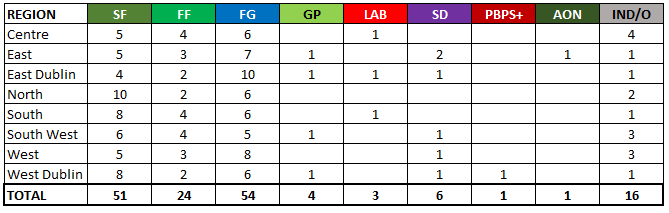
Above is the outcome broken down by each region. It’s overall relatively kind to small parties – as it allows aggregation of votes, which makes it easier to hit the threshold for a seat. For example, the Green Party, even with current polling difficulties, could win a seat in South West. In GE 2020, they won no seats in the five counties I’ve put into this region, despite much better polling numbers. In short, it’s easier to win 1 seat from a big pool (20), than try to win one seat out of any of multiple of smaller pools (in this instance pools of 5, 4, 4, 3 and 3).
So does this mean the Scottish system of AMS, or even a full-on national list system, is better? There’s a fairly prevalent view among a certain type of wonk that it is, because the function of democratic systems should be a pure reflection of proportional votes. In my view, this is a fallacy. PR-STV is out of line with purely proportional systems because it is based on a slightly, but significantly, different conception of what democratic choice looks like.
PR-STV has two key factors that a purely proportional list system doesn’t. Firstly, it puts a priority on a connection between an elected official and their constituents, giving people the ability to choose the person who represents them, and creates a connection to the area represented. The AMS system used in Scotland attempts to do both these things at once, but it’s questionable how effective it is as it completely disincentives small parties from contesting non-list seats, and allows very little room for Independent candidates.
Secondly, by using a version of ranked choice, it doesn’t just ask people who their favourite is and then chucks it away if they don’t hit the threshold. The idea of multiple preferences is based on the principle that your vote can count as many times as you want it to. Neither of the two factors used to create AMS – FPTP and d’Hondt – allow for this.
But asking which outcome is better, or worse, or more or less democratic, strikes me as an exercise in missing the point. It’s a different way of measuring people’s priorities, and it’s interesting to see how our system creates different outcomes to when seats are allocated simply by a mathematical formula.
