As there’s minimal polling in July and August, I decided to take some time to look into whether or not polling can be useful in terms of projecting local elections. Local elections will take place next year, before the upcoming General Election, so I had a look using a similar methodology to the one I use for the GE projections.
The very short answer is no. At slightly greater length, I think it can reveal broad ballpark national trends, but I don’t believe it can with any great accuracy – particularly at the level of individual councils. However, this was a monstrous project that I spent a lot of time working on, so I figure I might as well put it out as it may be interesting, even if I think there’s a ton of problems that cannot be resolved. I will discuss these problems more further down.
I really want to emphasise before anyone reads this that this should be viewed as something done for fun and for interest, this should not be taken seriously as having any substantial predictive value. I am fairly confident that the General Election projections are reasonably – though very far from perfectly – accurate, given the assumption of reasonably accurate polling. I do not have any of this confidence when it comes to locals, so please bear that in mind as you read through this.
Methodology
The methodology used for this was broadly similar to that used for GEs – measuring provincial swing from the last election and applying it per Local Electoral Area (LEA). However, the GE projections are use the actual election results as an anchor point; I did not do this for LEs, rather doing a pure comparison of polling to polling. This actually has some potential benefits – as it by default factors in polling errors and house effects – but also has some potential weaknesses in assuming that those errors and effects are consistent between 2019 and current polling.
I did this because the high number of LEAs and low numbers of candidates from small parties skews terribly when the real results are added. For example, if a party runs one just one candidate in a county and they do well, how do you proceed? Do you take a raw measurement, which means that that party’s vote share will be miniscule and the model will wipe out the seat? Or do you assume that everyone will do as well and thus start blindly assigning more seats to them?
This isn’t really necessary for the GE as there’s a much smaller number of constituencies, but for locals, where there are 166 LEAs with 949 seats, it becomes highly problematic. Using the polls-to-polls comparison avoids this, though it’s also not a perfect system as it diminishes the impact of actual results on the modelling. That said, the adjustments are still applied to the actual vote totals.
Problems
So what are the problems that make this so unreliable? I think it’s worth laying out what I came across, both to add context and also to demonstrate the difficulties here. And there are a lot of caveats. Here is a non-exhaustive list:
- In addition to the uneven candidate distribution above, this has to assume parties and Independents will only contest in LEAs they contested in 2019, with no additions or subtractions. This is, of course, not going to be the case, but there is no alternative other than guessing at random, or assuming everyone will contest everywhere – both of which are even more unrealistic.
- There are a lot of individuals elected in 2019 who are no longer on council – either due to entering the Dáil or Seanad, deaths or retirements. It is not possible to measure the impact of these.
- There are several parties that didn’t exist in 2019 that will presumably run in 2024. These are all quite small and aren’t polled, so it’s impossible to factor them in.
- I have had to sort of pretend that defections or expulsions don’t exist; the modelling otherwise is borderline impossible. Hence the numbers below use the figures for those elected in 2019, not the current sitting councillors.
- Local elections are really swingy, more so than general elections. The Sinn Féin number is maybe a bit low because they did so terribly in many places in 2019 that even with significant polling swings, their base number from 2019 is way too low to have them take a seat.
- The model, as with the GE model, is probably a little harsh on Independent candidates; although their polling numbers are significantly worse than in 2019, it is difficult to project who will be affected by this as the distribution and resilience of support is very uneven and highly personalised
- In general, variations to provincial figures are much higher in LEAs than they are in Dáil constituencies by dint of their size, so the predictive value is substantially lessened.
- Some of these involve very fine margins; for example the modelling shows all Green seats on Cork City Council disappearing, but all of them by fractions of a percent.
- Overall this means the modelling is fairly conservative – except for the Soc Dems, who get crazy swings. This isn’t impossible of course – the Greens in 2019 are a good example.
- And this is the biggest one: polling is, in general, poorly predictive for Local Elections. Polls usually specifically ask about who people would vote for in the next GE, and people do have different preferences in each.
Projections
With all that in mind, here’s what the projection shows:
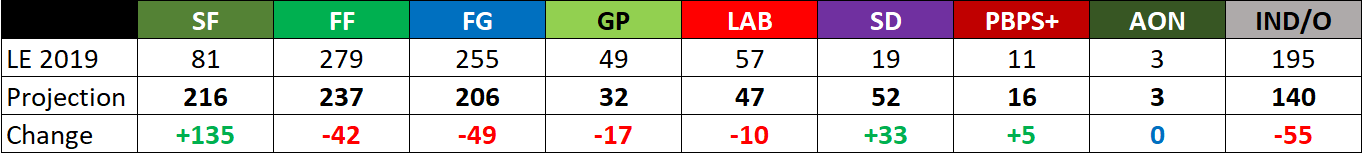
Note that the 2019 figures are not the precise current figures, but the numbers elected in 2019, for reasons outlined in the previous section. I’ll talk more about the individual party measurements one by one in the analysis section below.
I’ll discuss these figures a bit more in the analysis section below, but here’s also a map of the changes in the biggest party on each council (pluralities – not majorities!), comparing 2019 to the 2024 projection:

This paints a similar picture to the overall numbers – significant gains for Sinn Féin, particularly around the border and in Dublin and parts of its commuter belt, but hardly an obliteration for the other major parties.
I’m hesitant to outline the full breakdown by LEA or council here because I really don’t think the numbers are reliable outside of providing a broad guideline. I think the aggregated whole is reasonably representative, but once we start getting into individual LEAs it gets a bit out there and I’m concerned it could end up being taken out of this extremely cautious context. I think councils are a bit more reasonable – though I would still advise a large amount of caution with these figures, which should again be taken as indicative rather than predictive, and there are some immediate outliers that should jump out on even a cursory inspection. I will post the overall breakdown here:

If you’re wondering about those two columns on the right, they represent a very crude measure of left/right balance of power per council. For convenience, the groupings are FF, FG and Aontú on the right, and everyone else on the left (you can argue among yourselves about the classification of the Greens and Labour), with Independents in their own bucket. “IND BOP” means that neither the left nor right groups have a majority, and the balance of power is held by Independents/Others.
I say this is “crude” because variations within local parties can be substantial – for example it is absolutely possible to point to explicitly right-wing Sinn Féin councillors. Furthermore, Independents/Others run the gamut from old-school Marxist-Leninists to outright fascists, with a whole bunch of inscrutable localists in between who have strangely little political inclination for, you know, elected public representatives. Categorising them one by one is is a borderline impossible endeavour for very little benefit, so I haven’t bothered.
As you can see there is a fairly universal shift leftwards – as would be expected in a situation where SF’s support is rising pretty much everywhere. However, this should not be taken as an indication of how council ruling groups will form (nor, in fact, should a council ruling group be considered in any way equivalent to a majority in a parliament – that isn’t how councils are structured). To illustrate this, Dublin City Council was the only council with a nominally left-wing majority elected in 2019 – yet the ruling group ended up being a frankenstein of FF, the Greens, Labour and the SDs.
Analysis
Let’s start with Sinn Féin. These numbers probably shouldn’t be too surprising overall – SF positively shit the bed in 2019, but are now in a far, far stronger position. As noted above, I think these numbers are probably a little on the conservative side, as I suspect they will swing upwards more in areas where they did the worst in 2019. Conversely, they may have less room to grow in areas where their vote held up, but it is extremely difficult to assign a floor or ceiling to the party in a specific LEA; we simply don’t have data for this, nor have we had an past local cycle where SF were in anywhere near the kind of dominant polling position they are in today.
Either way, I will be stunned if they don’t make the biggest gains in 2024. Andalthough this modelling doesn’t show it, I wouldn’t be surprised if they end up the biggest party in local government for the first time – mirroring their achievement in Northern Ireland this year.
Fianna Fáil and Fine Gael are in a broadly similar position. In 2019, they won 534 of 949 seats between them. This was nothing new in the sense that FF and FG have, in some combination, never failed to majority of seats on local authorities (since both parties were established, or at least as far as I can find). The projection indicates them going below that majority threshold for the first time. This is fairly meaningless from a pure electoral politics point of view, but if it happens, will be another milestone continuing decline of the two major parties.
The thing is is though, the model thinks their polling losses are probably going to be greater than their seat losses, if they stay in this kind of range. There are many LEAs where FF or FG got absolutely dominant numbers – in some rare cases even in excess of 40%. This means that they have a lot of cushion. However, conversely to the issue with SF, what the model may miss here is that drops may be uneven – i.e. higher support areas potentially have more to lose. However, there’s no way to assume that is true. A lot will come down to how resilient their votes are in each locality, and that’s going to be dictated to a large extent by their candidates.
The Green Party one is interesting. Losing over a third of their seats would certainly not be good, but it is not a wipeout and it’s certainly nowhere close to their 2014 disaster. And, as noted above, a number of these seats shown as being lost are actually really, really close. So what’s different? Mostly, the fact is that their polling isn’t that much worse than it was in 2019. This is particularly true in Dublin, where their vote has a -14.8% swing. That sounds pretty significant until you consider that a lot of their candidates in Dublin racked up enormous FPV last time and can afford to easily eat that kind of loss while holding their seat.
It is also worth noting that the Greens, badly stung from last time, didn’t run multiple candidates in any LEAs in 2019, when there are places they really, really should have done so. Had they done so, they would be in line to lose a bunch more seats, but because of their cautious approach to 2019, they don’t hold those seats in the first place. Now, perhaps the backlash will be greater when people actually get to the ballot box, but I am inclined to agree that on current numbers, their council seats in Dublin will be much more resilient than some people will expect them to be.
Labour continue to be in a weird spot; their change in leadership hasn’t done a lot for a party that seems to be be struggling to find a way to grow support, and this reflects here with small losses as support is marginally down. Most of these are confined to Munster, where their polling is in relative terms significantly worse than in 2019 – elsewhere, the differences are very marginal. It should be pointed out that Labour generally did better in the local elections than in GE2020, so the improvements in Dublin in GE terms don’t apply here. But there is also one other factor that I suspect is preventing them from making more progress in Dublin – the next party I’ll talk about.
The Social Democrats are in a position where they could do what the Greens did in 2019 – the small party making a modest, but large in relative terms, gain of seats on a small boost in their vote. While small parties often operate within fine margins, the impact of going from, say 2% to 5% in a local election can be quite significant. The modelling here is probably being a little on the generous side in some cases, but it does mostly point to gains in urban and commuter belt areas, which would make a lot of sense given the way SD support is distributed.
We are, of course, still talking about small shifts for a party that doesn’t have a tremendous presence in a lot of places, and we have seen them struggle in areas where they should be a natural fit before. Thus, there is a lot of potential for them to underperform, but I don’t think suggesting they see a Green-level surge in 2019 is unreasonable.
Further left, the model sees small gains for PBP/Solidarity (albeit relatively significant ones given their current number of councillors). Buried under the story of the SF collapse, PBP and Solidarity had a rotten election in 2019, losing 17 of their 28 seats. Modelling shows them regaining a bit but still falling short of their 2014 performance. However, as their vote totals are quite low overall, and they run in a limited selection of LEAs, polling misses become increasingly volatile so they could easily over- or under-perform this, but it’s probably a good ballpark. And perhaps the dynamic of running on a unified list next time might help – there were some LEAs where both constituent parties ran last time (as I don’t believe they had formally agreed to a joint party yet) and it resulted in a really non-optimal number of candidates.
There’s not much to say about Aontú – polling data for them for 2019 is spotty, and the party’s few success have been due to hyper-local support. There is very little to indicate a wider breakthrough for them, but it’s very difficult to say they won’t drag out a couple more candidates who can get over the line – but it’s also very difficult to be confident about them holding seats from polling data.
There’s not much to add about Independents that hasn’t been mentioned above – generally their polling is poor at the moment, but it’s tough to say who does and doesn’t get hit from this. My inclination is that the model is underestimating them as established candidates may be tougher to dislodge than the numbers show.
As for other parties, I’m not going to try to make any great assumptions as the data simply isn’t there. I would view these groups that currently hold seats – Right2Change, An Rabharta Glas, Independents 4 Change, the Workers Party, the Workers & Unemployed Action Group, Republican Sinn Féin, the Independent Left, the Kerry Independent Alliance – as in the same statistical bucket as Aontú, insofar as it’s not really possible to tell how they will do, especially as there is no polling at all on any of these. Parties that don’t currently hold seats are even more of an unknown, but most of them are total crackpots so… don’t rule them out.
In summary, I think this is interesting and shows a reflection of polling trends and we can get some interesting information from that, but this should not be taken as a particularly meaningful projection. I may revisit this closer to the election to see how it changes with candidate numbers, polling movements and so on. Similarly, local elections themselves should not be taken as hugely predictive for GEs, but they can reveal certain things – it will be very interesting to see how resilient certain votes are, especially for candidates who are co-optees and have less of a built-in personal vote.
Thanks so much for reading! This website is done entirely in my spare time and run without ads, so if you want to donate, please do so via Patreon or Ko-Fi – any support is greatly appreciated and 100% of any donations received are invested into the costs of running and improving the site.
